
See moreUnderstand deeperDecide faster
Your AI consultant for international trade, available 24/7. In-depth analytics on tens of millions of real trade records, the full supply chain, answers in seconds
The market moves faster than humans can make decisions
Fresh produce is dozens of product categories, hundreds of suppliers, thousands of daily transactions, and prices that reset every day. The supply chain is fragmented across systems: wholesale prices at origin, export documents, vessel positions, customs declarations, retail prices — all scattered. Nobody sees the full picture
Bananas are the world's most-sold fruit: Ukraine alone imported over $700M worth in the last four years. High volume and a long supply chain from Ecuador to the retail shelf — this is exactly where our service delivers the most value. That is why bananas became the first product category we worked through in detail. The same approach will be extended to the remaining fresh fruit and vegetable categories
Without complete data, companies are forced to make decisions blindly. Importers overpay because they don't know competitor pricing. Exporters enter the market without understanding its structure. Traders react to trends only after they have already played out. Manual data collection and analysis take days — and during that time the market situation changes
Supply chain data is scattered across dozens of disconnected systems
By the time a manual price report is ready, the market has moved on
Business decisions are made on intuition instead of verified data
New entrants and fast-growing competitors are spotted too late
An analyst's report becomes outdated before anyone finishes reading it
How StatMetrica works
We connected every link of the supply chain into one system. Instead of manually collecting data from disconnected sources, you ask one question and get an answer that accounts for everything at once
The system's main advantage is the expertise normally available only to specialists with years of market experience. StatMetrica identifies the quality class of each product brand. It distinguishes actual exporters from intermediaries — brokers, warehouse operators, and transport companies that appear as shippers on paper. It detects affiliations between importers and exporters even when they are registered as separate legal entities
These details change the entire market picture. Without them, the ranking of top importers is inaccurate, market shares are distorted, and price analytics rely on averages that conceal the real structure of deals. StatMetrica shows what is actually happening on the market, not what is formally documented
Multi-Agent AI
Several specialized models work in parallel — each responsible for its own domain
Natural Language
Ask in any language — the system understands and returns a structured answer with numbers
Forecasts and trends
We see the market as a whole and build mathematically grounded forecasts for prices, volumes, and the supply/demand balance
How it differs from generic AI
Generic AI models are trained on the open internet and generate plausible answers based on probabilities. We trained our system on our own verified trade database — with numbers and sources for every answer
What we see right now
The full supply chain of banana imports to Ukraine — from farm to store shelf
Ecuador
Wholesale banana prices updated daily
Exports
Export notifications: who, where, which brands, how many boxes
At sea
AIS tracking of vessels and ports worldwide — routes, speeds, estimated arrival times
Customs
Actual declarations: volumes, prices, importers, exporters
Retail
Retail prices in Ukrainian supermarkets — the final link
Platform Capabilities
Complete Market Picture — in Seconds
Ask in plain language — get numbers, market shares, rankings, and comparisons. No Excel, no manual exports, no waiting
Supply Forecast 2–3 Weeks Ahead
StatMetrica tracks vessels via AIS (Automatic Identification System) — the same technology used by ports and shipping companies. Each vessel transmits its coordinates, speed, and course. In parallel, the system knows what's on board: export notifications contain exact volumes, brands, exporters, and destination ports
An importer sees that in 18 days, 3 vessels with a total of 400,000 boxes will arrive in Odessa — downward price pressure. Or the opposite: an empty week ahead, deficit, prices going up. This information is updated automatically
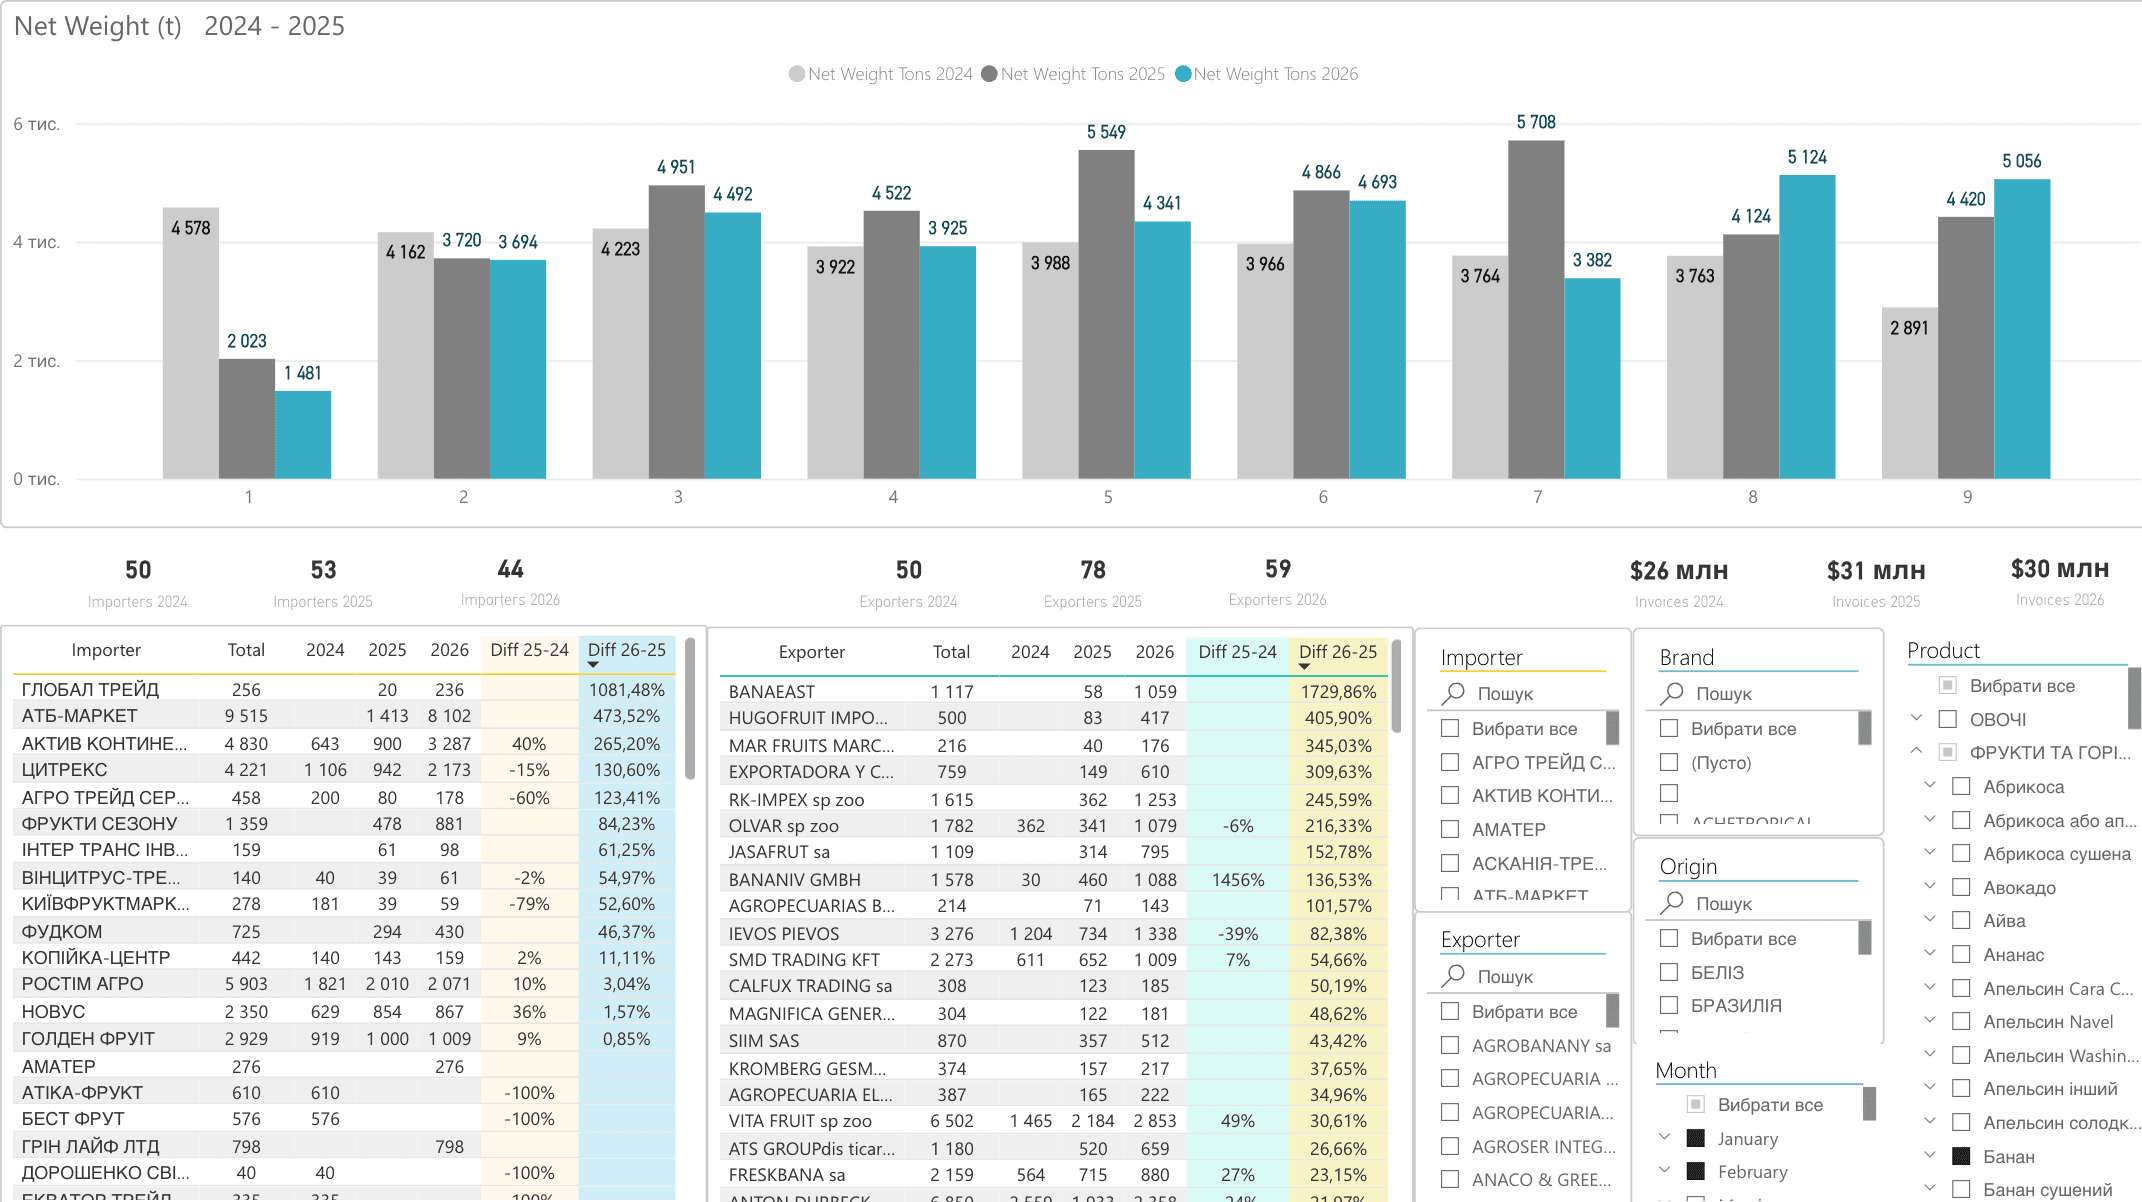
Interactive Power BI Dashboards
The visual analytics layer — for those who want instant answers without writing queries. Interactive Power BI dashboards give fast, intuitive access to data in a few clicks: the right market slice, right when you need it. Filters by product, country, period, importer, and exporter. Data updates automatically. Works online — no installation required.
From Question to Answer in 30 Seconds
Ask a Question
Phrase your query as plain text — for example: 'Top 10 banana importers in 2025 compared to 2024'
AI Analyzes
Specialized agents process the query in parallel: data retrieval, calculations, context, conclusions
Get the Answer
A complete report with figures, comparisons, and recommendations — in seconds
Available in popular channels
API integration with any corporate messenger
Who StatMetrica Is For
Every market participant gets their own value — from importer to investor
Fruit & vegetable importer
See competitor market shares and prices — avoid overpaying. Know the volumes in transit — plan purchases with future supply in mind. Monitor your supplier: do declared volumes match actual shipments
Exporter / producer
Understand market structure before entering: top buyers, existing brands, price corridors. See who your competitor-exporters work with. Assess seasonality — when to enter, when the market is oversaturated
Trader / broker
The gap between export price and import price is your potential margin. Track vessels: know cargo in transit and forecast supply/demand balance ahead of others
Logistics company
Port load forecast: how many vessels will arrive in Odessa or Chornomorsk next week, from which exporters, with what volumes. Plan transport, warehouses, and staff 2–3 weeks ahead
Bank / financial institution
Client due diligence: real volumes, shipment frequency, supplier list, price adequacy. Identify affiliated structures and dual-market suppliers under sanctions pressure
Insurance company
Cargo-in-transit assessment: what's on board, value, route, time at sea. Client shipment statistics — volumes, regularity, suppliers. Detect price anomalies signaling inflated insurance values
Analyst / media
Hard facts for publications: concrete numbers instead of expert estimates. Trends, top players, seasonality — ready material from one query. Verify public claims made by market participants
Investor / new entrant
Market assessment before entry: volumes, margins, competition, barriers. Who dominates, which niches are open, which products are growing. Minimum entry volume — all in hard numbers
The Technology Stack
Multi-Agent AI Architecture
Orchestration of specialized AI agents via LangGraph. Each agent handles its domain: data, calculations, context, conclusions. 40–60% token savings
ClickHouse
Columnar analytical database. Aggregation across 100M+ rows in milliseconds. Optimized for time series and OLAP queries in trade analytics
PostgreSQL
Primary relational database for metadata, users, agent configurations, and query history. Reliability and ACID transactions
Vector DB (Qdrant)
Semantic search across the knowledge base and SQL templates. Embedding models convert user queries into vectors for precise data matching
RAG Pipeline
Retrieval-Augmented Generation — extracting relevant SQL patterns and context from the knowledge base before generating a response. The system learns from every interaction
AIS Integration
Connection to the global AIS system across 4 ocean zones. Coordinates, speed, course — every 3 hours. Linked with export notifications
Redis + Queues
Hot query caching and task queue management. Asynchronous processing of heavy analytical queries without blocking the user
Observability
Full monitoring: request tracing via LangSmith, performance metrics, anomaly alerts. Every AI agent step is logged
ETL Pipelines
Automated data cleaning and enrichment pipelines. Deduplication, HS code normalization, entity-to-beneficiary mapping, price validation
Security
Data encryption at rest and in transit. AI Stateless — raw data is not retained by the model. GDPR compliant. EU-based infrastructure
About the Company
StatMetrica is an MVP-stage project. The team combines expertise in trade analytics, AI development, and business automation. We're building a tool that makes international trade transparent and manageable
The first users of our test version are large European traders and Ukrainian retail chains. They have access to the platform, use it on real tasks, and we collect feedback and refine the product based on their needs
After company registration in Germany, we'll launch the commercial version. In progress — expansion to the rest of fresh fruit and vegetable categories and new countries
Mission
To make international trade transparent and manageable
Where We Are Heading
Launch
- Business registration in Germany
- Launch of commercial analytics version
- Start of commercial operations
Growth
- Launch of Documents Cross-Check
- Database expansion to EU
- 20+ clients
Scale
- Global trade data
- API for enterprise clients
- Price and volume forecasting based on AIS, weather, and news
Get in Touch
We are ready to show how StatMetrica works with your specific tasks. Request a personalized demonstration.
info@statmetrica.com